Quick Start Guide
This guide walks you through building a simple Dashboard and publishing it to the cloud for others to view at any time. The example scenario monitors an air conditioner: the dashboard includes a power indicator lamp and two values showing the target temperature and the current temperature.
Intended audience: users who already have a Weincloud account and want to bring HMI data into a Dashboard.
Before you begin, prepare the following:
- A cMT X Series HMI
- A Windows PC with EasyBuilder Pro V6.06.02 or later installed
Building a dashboard takes six steps:
- Get a Weincloud Domain
- Activate Weincloud Dashboard
- Configure Data Source tags
- Map Data Source tags to device addresses
- Make a Dashboard
- Publish a Dashboard
1. Get a Weincloud Domain
Dashboard is a service under Weincloud, so you need a Weincloud Domain before you can use it.
Please see Domain Creation to create your own Domain.
2. Activate Weincloud Dashboard
After logging in to Weincloud, see Activation of Dashboard to add an HMI to the domain and activate the Dashboard service.
Note: If this is your first time using the Dashboard service, you are encouraged to start with the 90-day free trial.
3. Configure Data Source tags
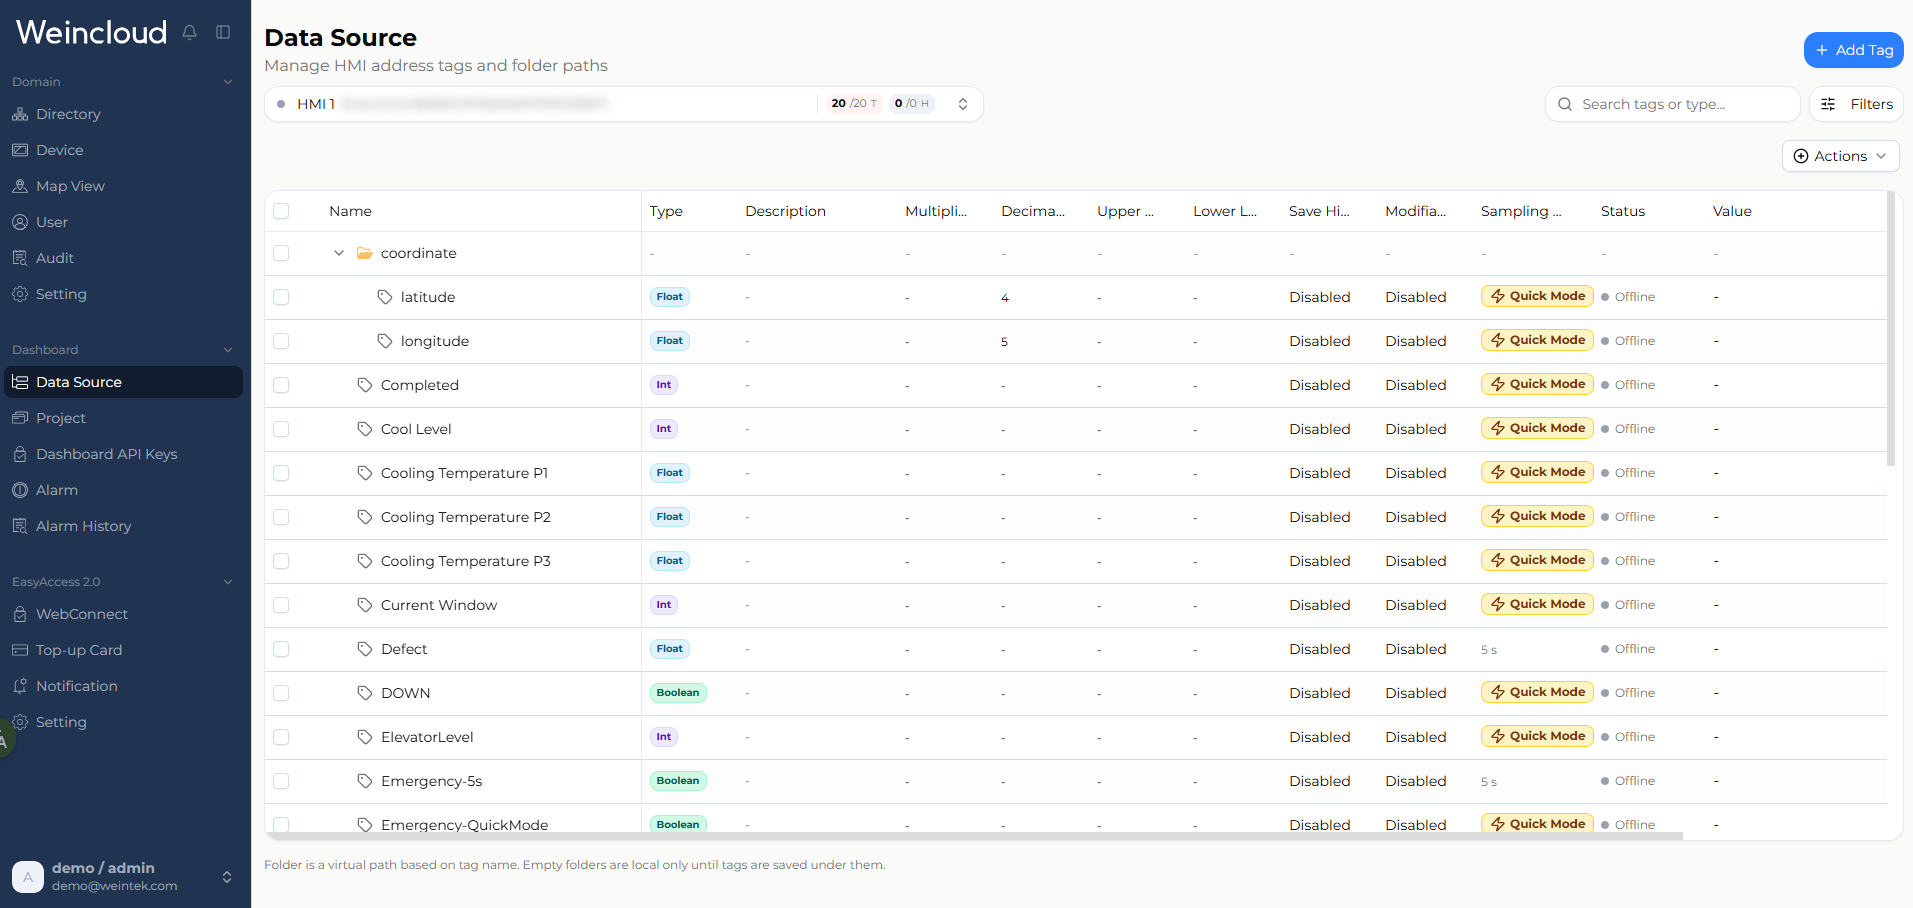
Open the Weincloud Dashboard [Data Source] page, select the HMI added in the previous step, click [Edit] to enter edit mode, and create the following three tags:
- Click [Add Tag]. Name the tag "power" and set the data type to "Boolean"; leave the rest unchanged.
- Click [Add Tag]. Name the tag "set-temp", set the data type to "Float", and uncheck the decimal point position and the upper/lower limit settings; leave the rest unchanged.
- Click [Add Tag]. Name the tag "current-temp", set the data type to "Float", and uncheck the decimal point position and the upper/lower limit settings; leave the rest unchanged.
4. Map Data Source tags to device addresses

Import Weincloud's Data Source tags into an EasyBuilder Pro project
In EasyBuilder Pro, open a cMT X Series project, open the [Weincloud] tab, select the correct Weincloud region, then click [Dashboard] to open the settings window. In the general properties pane, click [Login] and enter your Weincloud Domain credentials to log in.
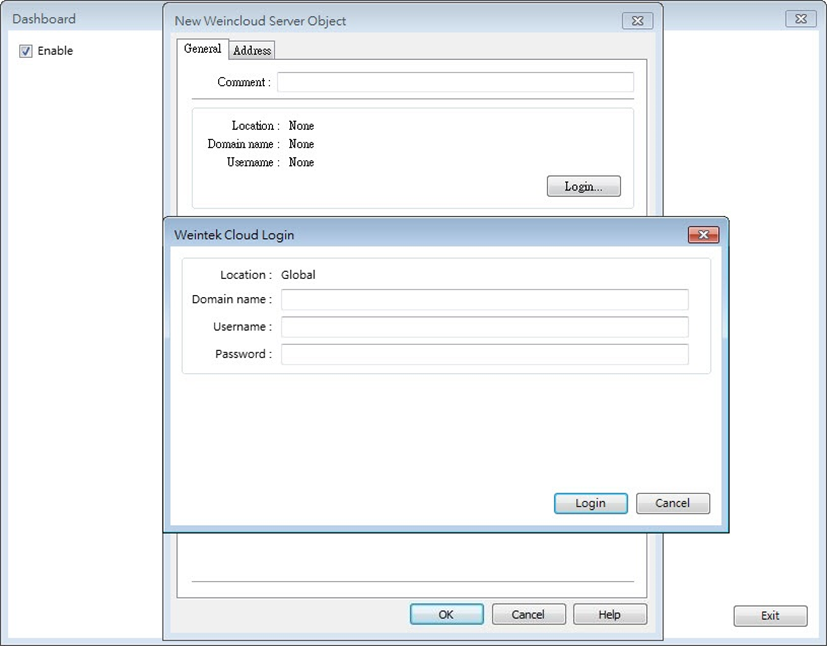
Weincloud server settings
In the Dashboard settings page, click [Sync] to open the [Weincloud Sync] window. The HMI list for the domain appears at the top; select the correct HMI and click [Sync]. EasyBuilder Pro downloads that HMI's Data Source tags from the Weincloud server and lists them below; click [OK] to finish the import.
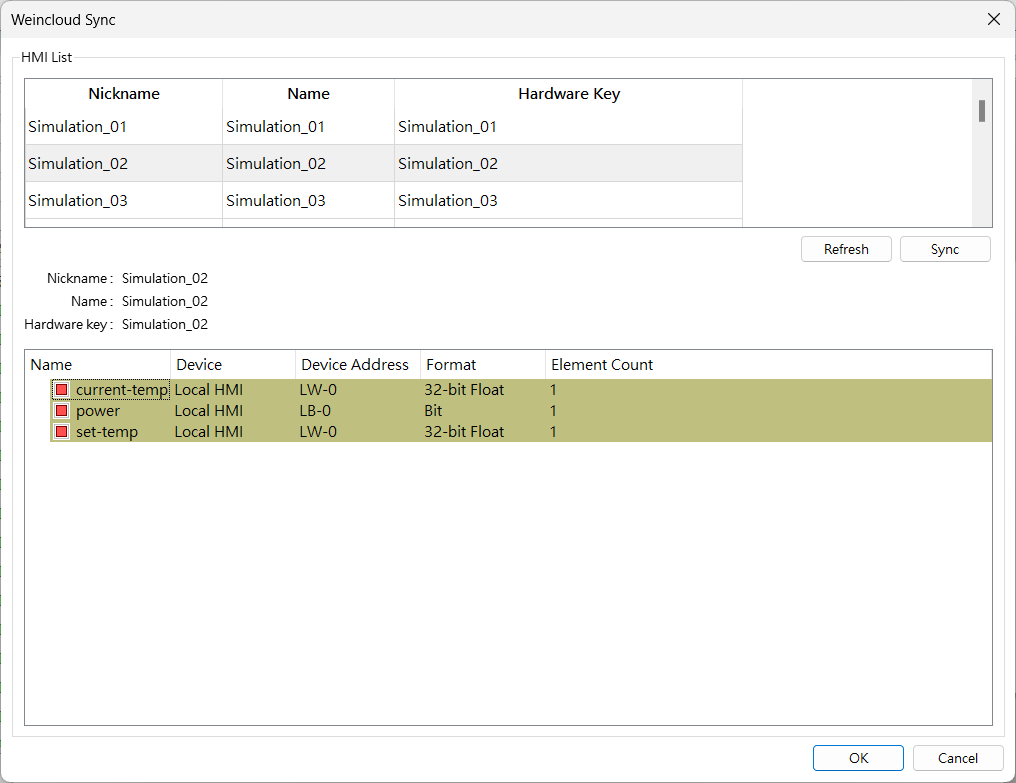
Import Data Source tags
Map Data Source tags to device addresses
When Data Source tags are first imported, they are mapped to default addresses (e.g. LB/LW-0). Double-click each tag to remap it to the correct device address.
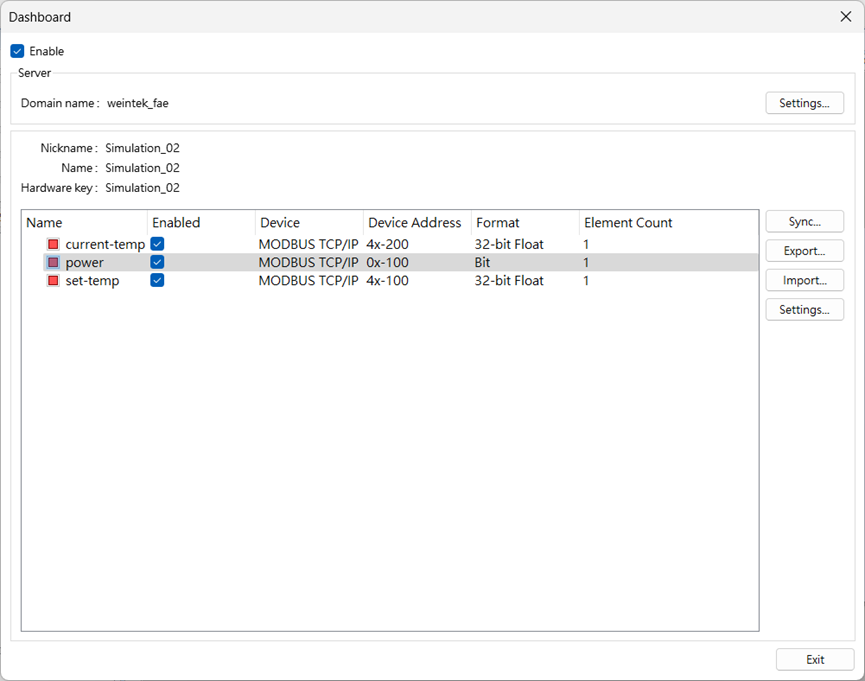
Map each tag to a device address
Note
In this example, the HMI communicates with the air conditioner over Modbus TCP/IP, and the Data Source tags are mapped to addresses 0x-100, 4x-100, and 4x-200 respectively.
Testing
After completing the settings above, download the project to the HMI.
Then, on the PC, open a browser, log in to Weincloud, and open the Dashboard [Data Source] page. The tag status should show [Online] with the real-time device values (a short delay may occur).

Tag status and live values after a successful connection
At this point the device status is synced to the Weincloud server. The next step is to display this data graphically on a dashboard.
Note: If a Data Source tag stays [Offline], see Trouble Shooting.
5. Make a Dashboard
In Dashboard, select [Dashboard Project], click [Create New Project], and enter a project name to open the editing screen.
You will create four widgets, labeled a, b, c, and d:
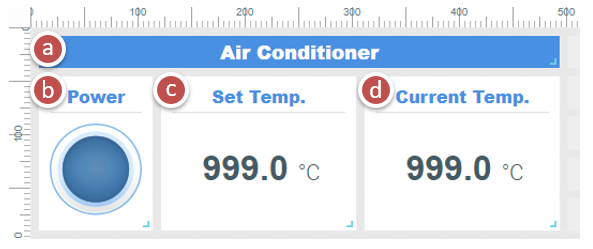
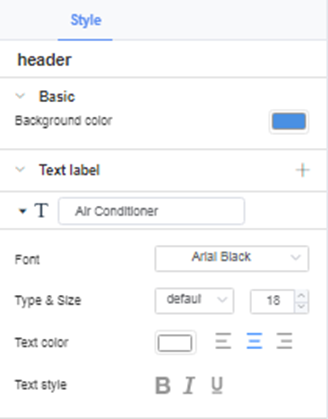
The "Air Conditioner" label
- Drag a "Label" widget onto the canvas.
- Configure the widget as shown below.
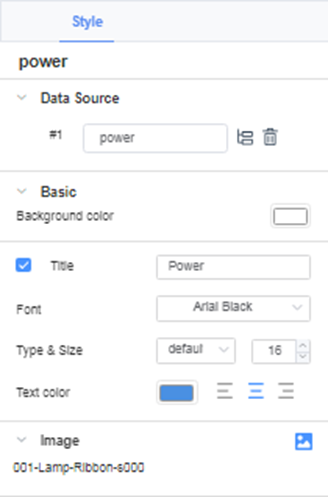
The "Power" lamp
- Drag a "Lamp" widget onto the canvas.
- Configure the widget as shown below.
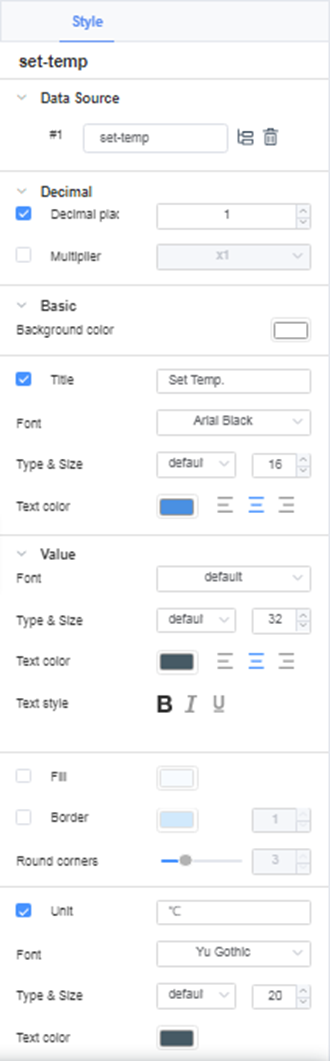
The "set-temp" value
- Drag a "Value" widget onto the canvas.
- Configure the widget as shown below.
The "current-temp" value
- Drag a "Value" widget onto the canvas.
- Configure the widget as shown below.
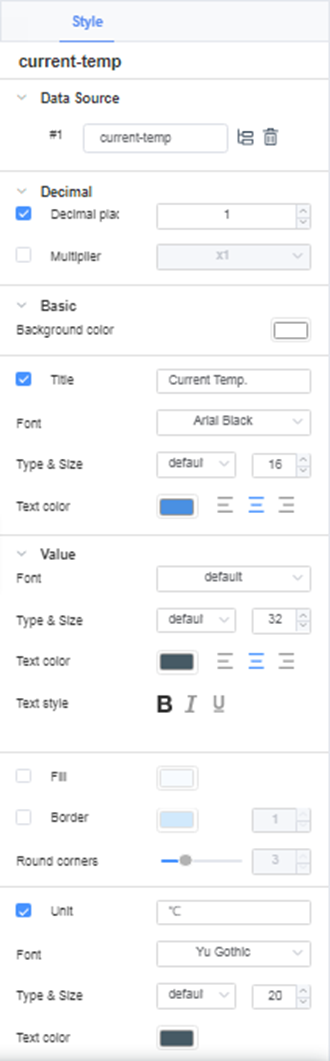
Preview
Once finished, click [Preview] to see the result.
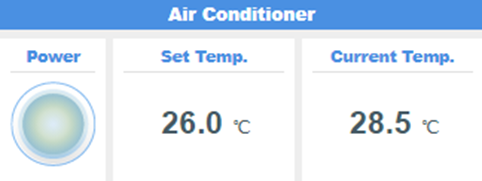
Dashboard preview
6. Publish a Dashboard
Once the dashboard looks as expected, click [Publish], select [Anyone with the link can view], and click [Copy] to get a link you can share so others can view the dashboard from any browser.
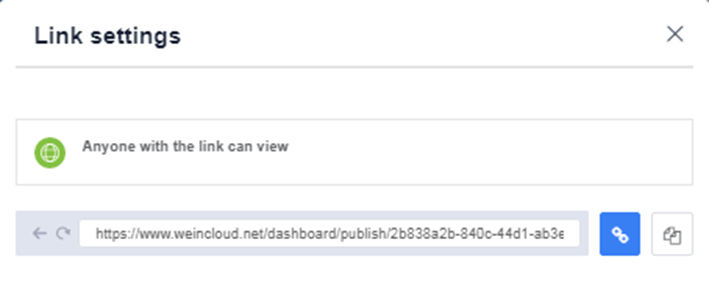
Publish the dashboard and generate a link
Note: To restrict access to specific users in the domain, select [Specific user] instead.