PowerBI
Overview
This article explains how to call the Dashboard Data API from Power BI using Power Query (M language), to retrieve HMI tag history and build a line chart.
Prerequisites
- Power BI Desktop is installed
- A valid API key has been obtained (created under [Dashboard] → [Dashboard API Keys] in the left menu); see Dashboard Data API
Steps
Configure the API Query
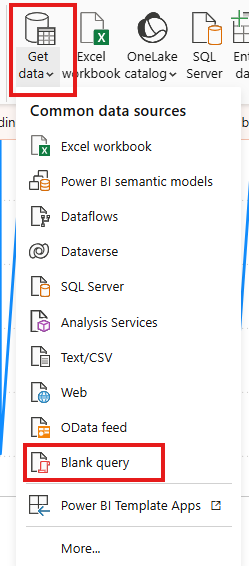
Go to Get data -> Blank Query to open a blank query for editing.
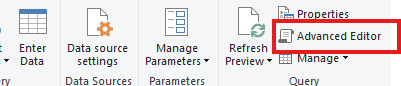
Click Advanced Editor.
Enter the following sample query, replacing hw_key, name, and other parameters with the actual tag information:
m
let
    // API URL
    apiUrl = "https://www.weincloud.net/dashboard/api/v2/open_api/history",

    // Get current UTC time
    endDate = DateTimeZone.UtcNow(),

    // 3 hours before
    startDate = endDate - #duration(0, 3, 0, 0),

    // Convert to ISO8601 format
    formattedStartDate = DateTimeZone.ToText(startDate, "yyyy-MM-ddTHH:mm:ssZ"),
    formattedEndDate = DateTimeZone.ToText(endDate, "yyyy-MM-ddTHH:mm:ssZ"),

    // Build the JSON request body
    requestBody = Json.FromValue([
        start = formattedStartDate,
        end = formattedEndDate,
        tags = {
            [
                hw_key = "Please Input Your HWKEY HERE !!!",
                name = "Please Input Your Tag Name HERE !!!"
            ]
        }
    ]),

    // HTTP request header
    requestHeaders = [
        #"Content-Type" = "application/json",
        #"X-API-KEY" = "Please Input Your API KEY HERE !!!"
    ],

    // Send the POST request
    Source = Web.Contents(
        apiUrl,
        [
            Headers = requestHeaders,
            Content = requestBody,
            Timeout = #duration(0, 0, 5, 0)
        ]
    ),

    // Parse the JSON response
    raw = Json.Document(Source),
    dList = raw[d],

    // Expand the array
    dTable = Table.FromList(dList, Splitter.SplitByNothing(), null, null, ExtraValues.Error),
    dExpanded = Table.ExpandRecordColumn(dTable, "Column1", {"hw_key", "name", "values"}),
    valuesExpanded = Table.ExpandListColumn(dExpanded, "values"),
    valuesFlattened = Table.ExpandRecordColumn(valuesExpanded, "values", {"value", "hmi_time"}),

    // Convert value to a number type
    #"Changed Type" = Table.TransformColumnTypes(valuesFlattened, {{"value", type number}}),

    // Convert hmi_time to a datetime type
    withDateTime = Table.AddColumn(
        #"Changed Type",
        "hmi_datetime",
        each DateTime.From(#datetime(1970, 1, 1, 0, 0, 0) + #duration(0, 0, 0, [hmi_time] / 1000)),
        type datetime
    )
in
    withDateTime
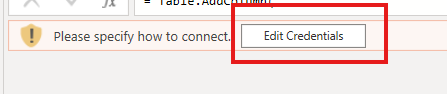
Edit the Credentials.
Select the API URL that matches your server region:
- Global service region:
https://www.weincloud.net/dashboard/api/v2/open_api/history - China service region:
https://www.weincloud.net.cn/dashboard/api/v2/open_api/history
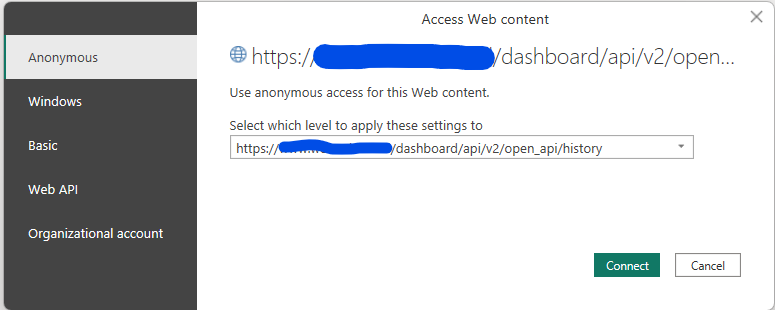
Close and save.
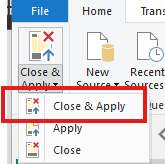
Create the Chart
Select LineChart.
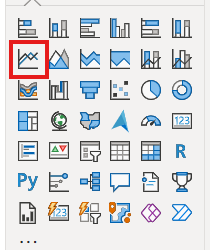
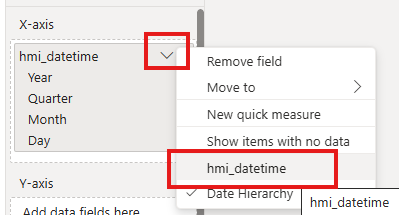
Place hmi_datetime in the X-axis.
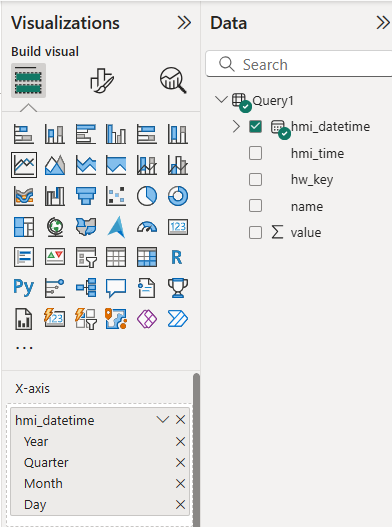
Choose to use the raw data directly, without applying any aggregation.
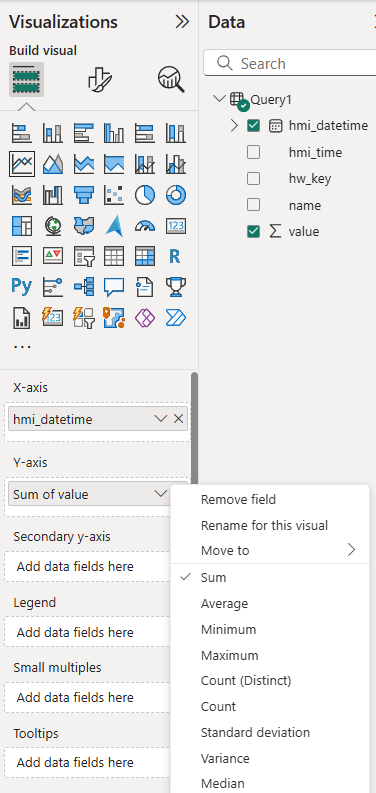
Place value in the Y-axis, and choose the desired aggregation method.
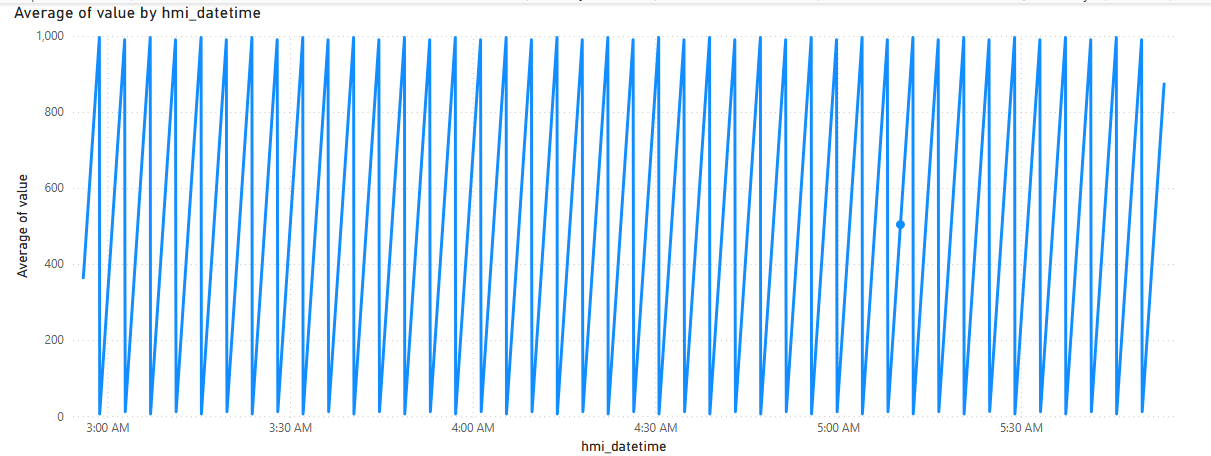
The trend chart for the tag history data is now displayed.