Grafana
Overview
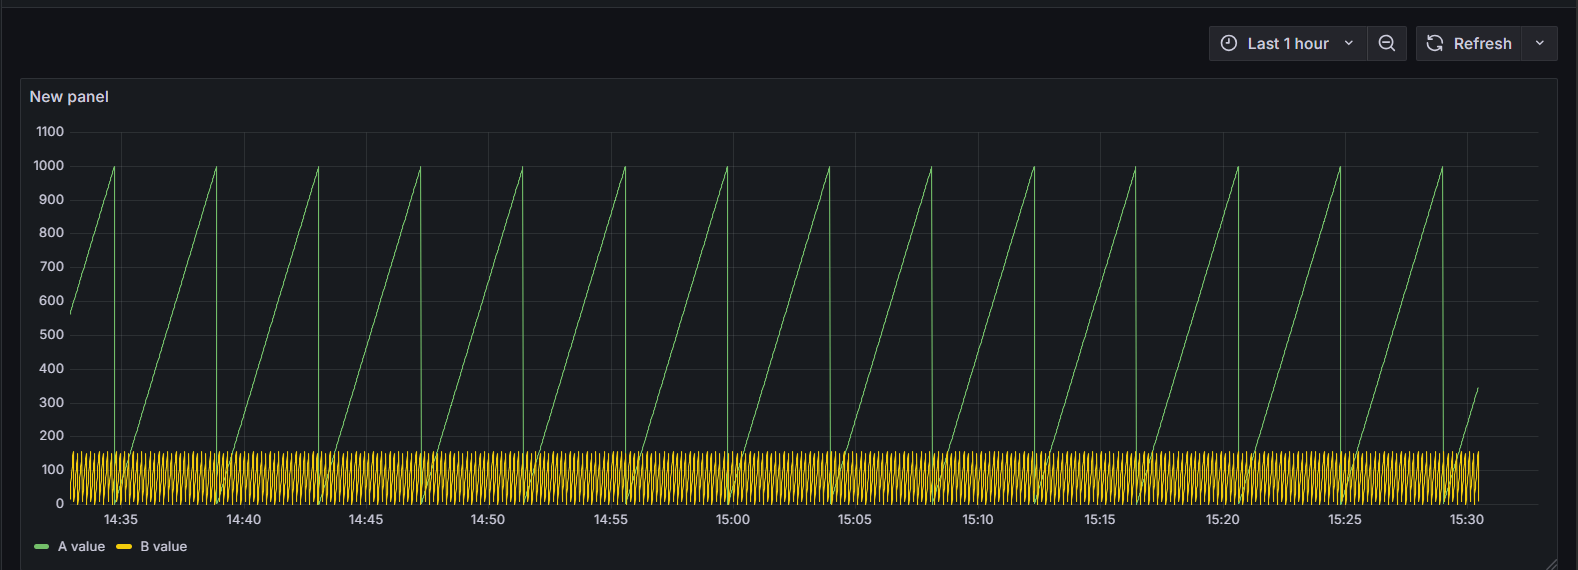
This article explains how to use Grafana's Infinity data source plugin to connect to the Dashboard Data API, so HMI tag history data can be displayed as a Time Series panel in Grafana.
Prerequisites
- Grafana is installed, and you have permission to add a Data Source and create a Dashboard
- A valid API key has been obtained (created under [Dashboard] → [Dashboard API Keys] in the left menu); see Dashboard Data API
Steps
Install the Infinity Plugin
Install the Infinity data source plugin in Grafana.
Configure the Data Source
Add a New Data Source
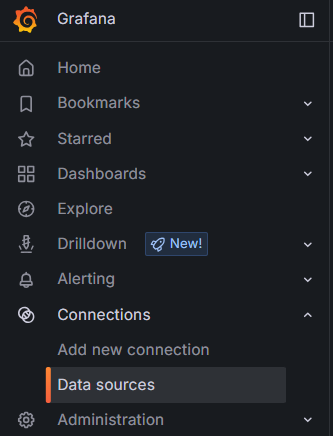
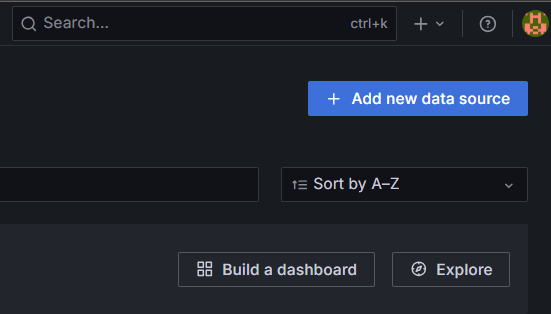
Go to Connections -> Data sources -> Add new data source.
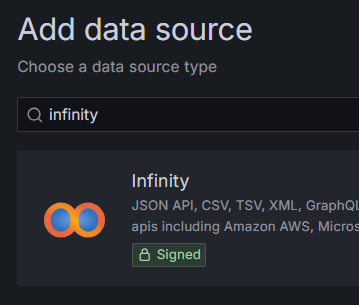
Select Infinity
Select Infinity from the list of data source types.
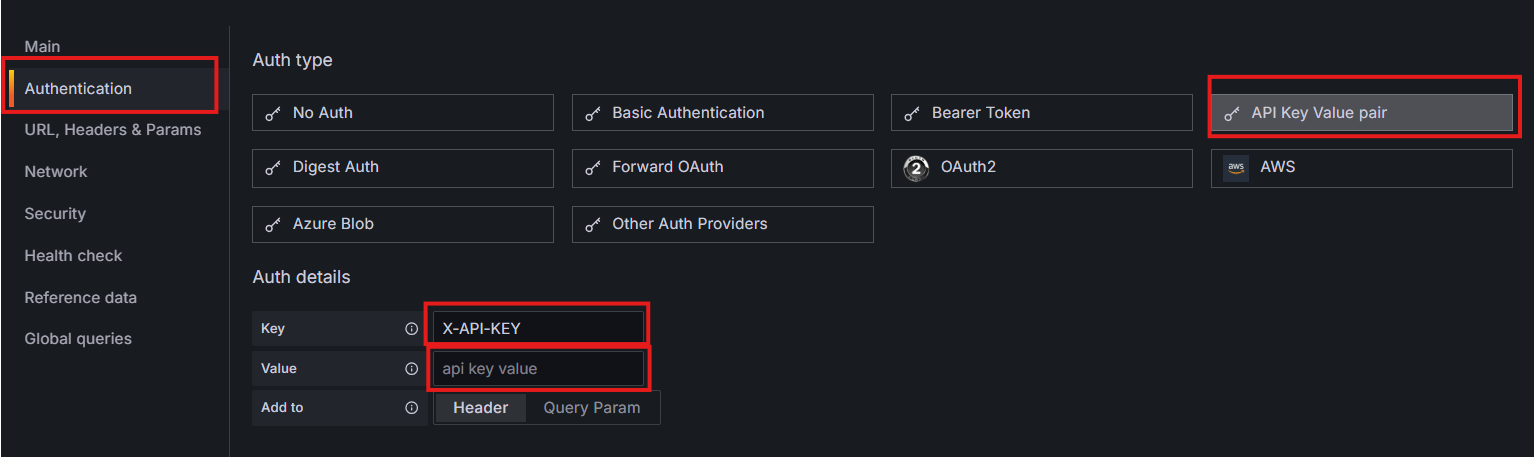
Configure Authentication
- Type:
API Key Value pair - Key:
X-API-KEY - Value: your API key
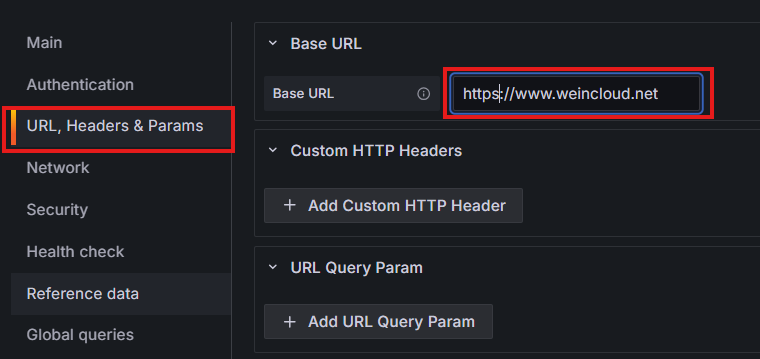
Configure Base URL
Enter the URL that matches your server region:
- Global service region:
https://www.weincloud.net - China service region:
https://www.weincloud.net.cn
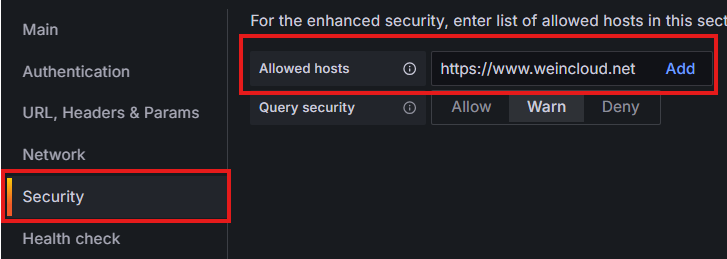
Configure Security
Add the URL above to the allowed hosts list, using the value that matches your server region:
- Global service region:
https://www.weincloud.net - China service region:
https://www.weincloud.net.cn
Create a Panel (Time Series)
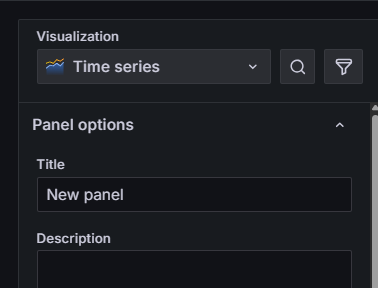
Select Visualization
Choose Time series for Visualization.
Basic Configuration
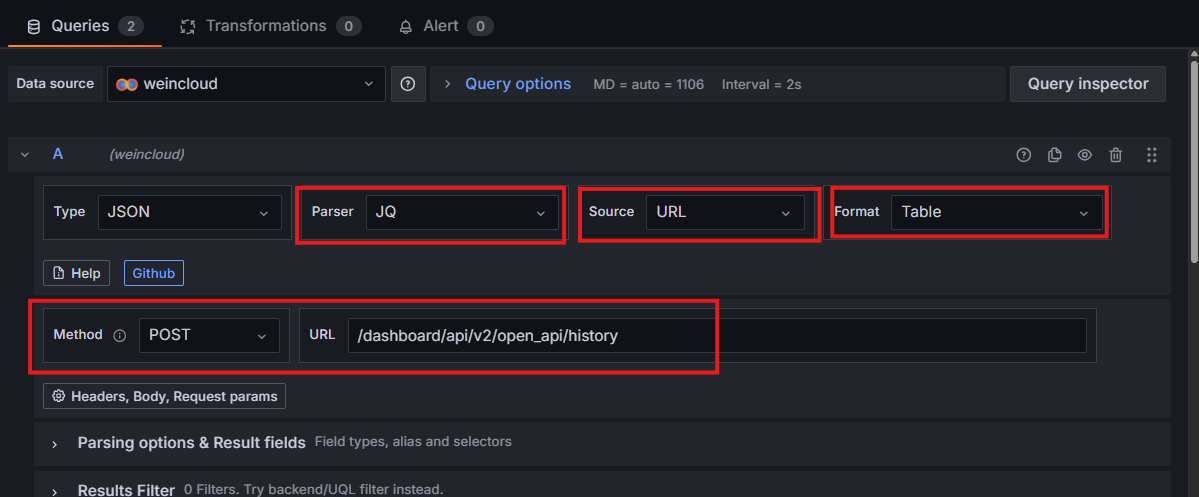
Select JQ for Parser, and use the Get Tag History API path:
/dashboard/api/v2/open_api/history
Configure Body
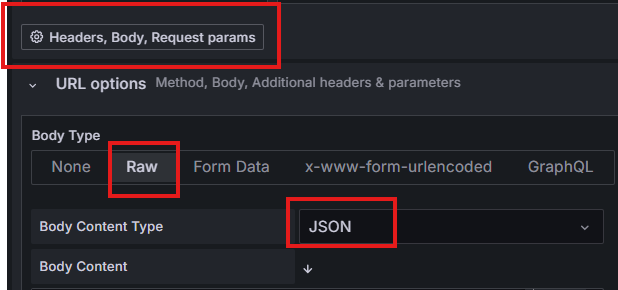
Expand Headers, Body, Request params:
- Body Type:
Raw - Body Content Type:
JSON
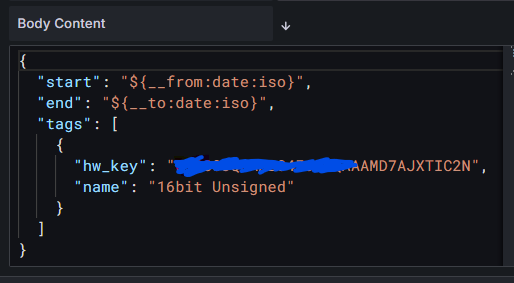
Enter the query content based on the API documentation. Example:
{
  "start": "${__from:date:iso}",
  "end": "${__to:date:iso}",
  "tags": [
    {
      "hw_key": "imhwkey",
      "name": "16bit Unsigned"
    }
  ]
}
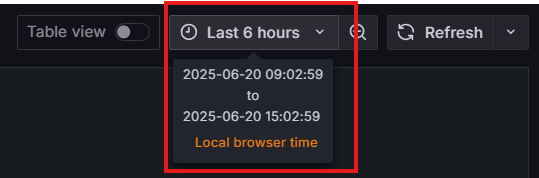
${__from:date:iso} and ${__to:date:iso} correspond to the time picker at the top of Grafana, letting you control the query's time range directly through Grafana.
Configure Result Parsing
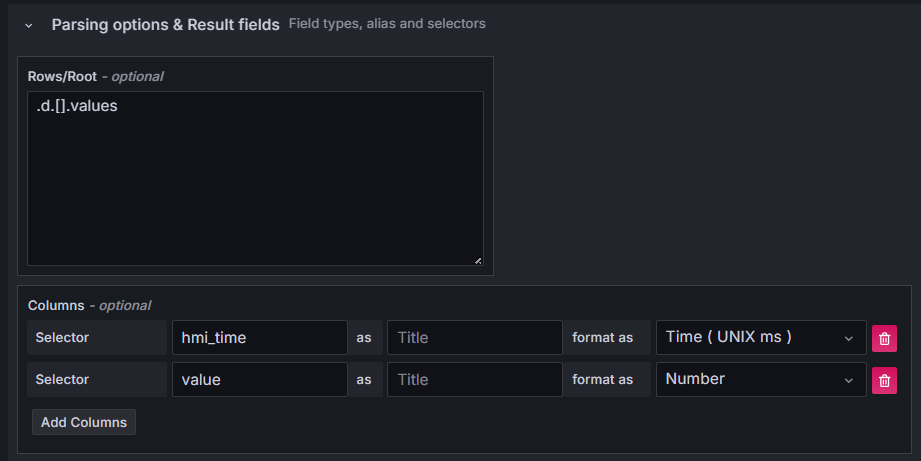
Click Parsing options & Result fields:
- Enter
.d.[].valuesinRows/Rootto retrieve the values data for each tag - Convert column types:
hmi_timetoTime(UNIX ms);valuetoNumber
Duplicate the Query for Additional Tags
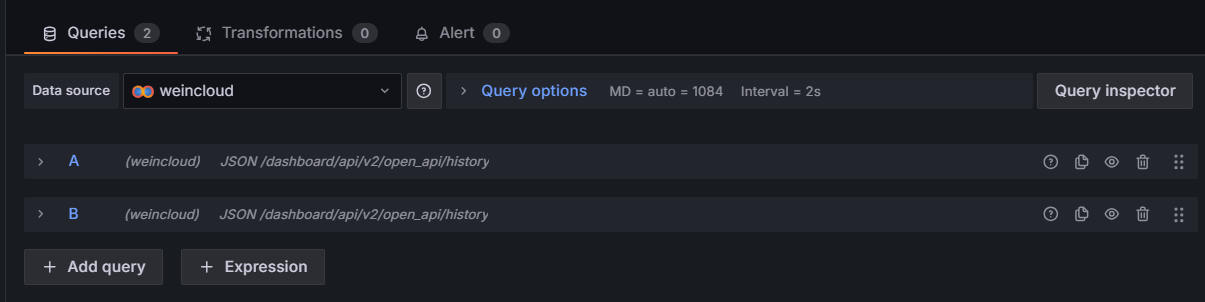
A single query only retrieves one tag. To display multiple tags, duplicate the query and update its tag parameters to retrieve the second tag.
Complete the Setup
Click Save Dashboard in the upper right to save the panel, or click Refresh first to preview whether the data displays correctly.