Audit Logs
Overview
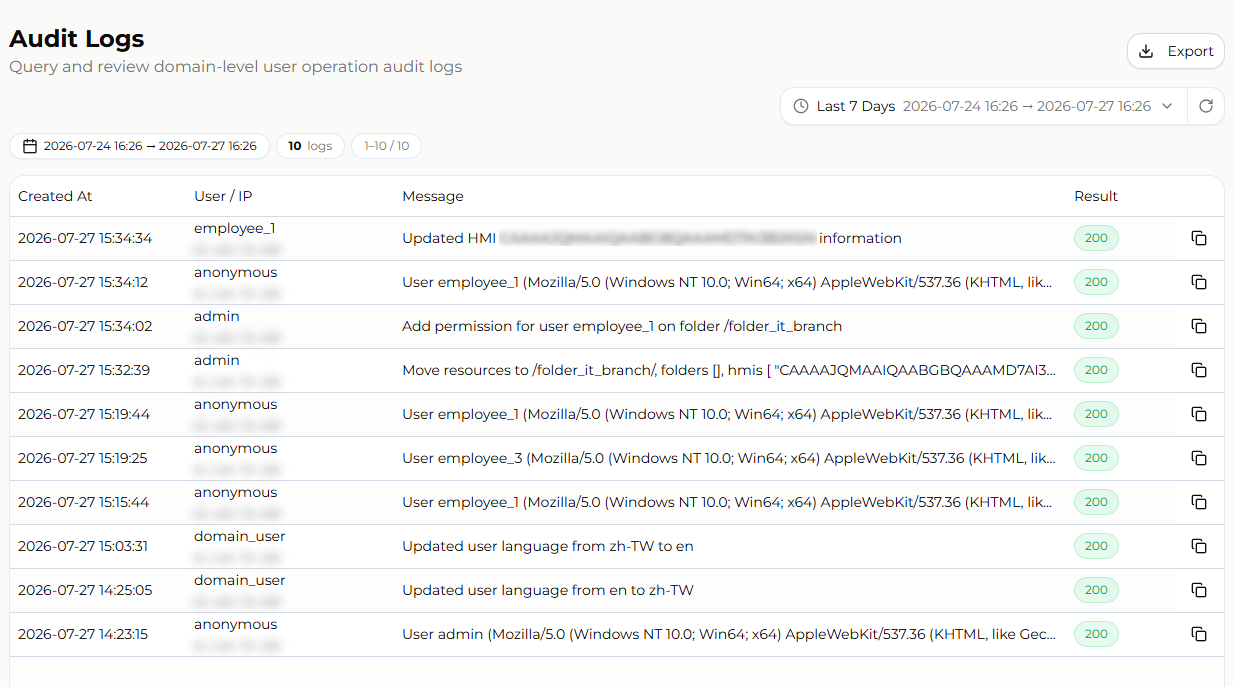
Audit Logs record the operations performed by all users within a Domain. Each entry contains the time of the operation, the account that performed it, the source IP address, an event description, and the result, forming a complete and traceable history.
The feature answers the question of who did what, when, from where, and whether it succeeded. It is intended for security auditing, tracing permission changes, and troubleshooting abnormal device or account behavior. Log entries are generated automatically by the system and are read-only; they cannot be created, modified, or deleted by users.
Use Cases and Intended Audience
- Domain superusers: This page is accessible only to accounts with the Domain Superuser permission. Subdomain superusers and regular users do not see this item in the menu. See Managing by Subdomain.
- Security auditing: Periodically review login records and account security operations (password changes, MFA resets, account unlocks, social account unlinking) to confirm that no unexpected source IP addresses or privilege escalations occurred.
- Tracing permission changes: Determine when and by whom a user's folder, HMI, or group permissions were modified.
- Troubleshooting: When a device, license, or Dashboard state does not match expectations, review the operations performed during the relevant period and their results.
- Technical support: Export the logs for a specific period as supporting evidence when reporting an issue.
Feature Details
Accessing the page
In the left-hand menu, select [Domain] > [Audit]. The page issues a query automatically on load; no manual action is required.
The default quick range is [Last 7 Days]. However, the query range is limited to 3 days (see Limitations and Notes), so the initial load returns records from the most recent 3 days and displays a [Time range restriction] notice.
Setting the query time range
The time range selector at the top right of the page shows the range currently in use together with its start and end times. Click it to change the query conditions:
- [Quick Range]: [Last 1h], [Last 3h], [Last 6h], [Today], [Last 7 Days], and [Last 30 Days]. Selecting one immediately re-runs the query with that range.
- [Custom Time Range]: Enter the date and time for [From] and [To], then click [Apply] to submit the query. [Clear] resets the range to the most recent 3 days; [Cancel] closes the selector without changing the conditions.
- Refresh: The refresh button to the right of the selector re-runs the query with the current conditions. Results are not updated automatically; use this button or re-apply the range to retrieve newly generated records.
The information labels below the selector show the current query interval, the total number of results, and the range of entries displayed on the current page.
Log columns
| Column | Description |
|---|---|
| [Created At] | The time the event was generated, in YYYY-MM-DD HH:mm:ss format |
| [User / IP] | The account that performed the operation and the source IP address of the request |
| [Message] | The event description, generated by substituting actual values into a message template. See Recorded events |
| [Result] | The HTTP status code of the operation. See the next section for interpretation |
| Copy button (last column) | Copies the message code of the entry (for example, log_10001) to the clipboard |
The [Created At], [User / IP], and [Result] columns can be resized by dragging the right edge of the column header. [Message] is a flexible-width column; long content is truncated with an ellipsis.
Interpreting the [Result] column
The [Result] column shows the HTTP status code returned by the operation:
- Green badge: A status code beginning with
2(for example,200), indicating that the operation succeeded. - Red badge: Any other status code, indicating that the operation failed. The status code itself indicates the nature of the failure, such as insufficient permissions or an invalid request.
Failed operations are recorded as well, so failed logins and unauthorized access attempts can also be traced here.
Paging through results
Query results are loaded at once and paged on the client side, so changing pages does not trigger a new query. At the bottom of the page you can set the page size to 10, 20, 50, or 100 entries (20 by default) and move between pages with the arrow buttons.
Exporting to CSV
Click [Export] at the top right of the page to download the query results as a CSV file:
- The export contains all records returned by the current query, not only those shown on the current page.
- The columns are, in order: Created At, Username, IP, Message, and Result.
- The file name follows the format
audit-logs_{start_date}_{end_date}.csv. - The file is encoded as UTF-8 with a BOM, so it opens directly in Excel without garbled characters.
- When the query returns no results, the [Export] button is disabled.
Recorded events
The following events are currently recorded. Values enclosed in braces (for example, {username}) are placeholders that are replaced at display time with the corresponding account, folder path, device hardware key, or other value. The message code is the identifier retrieved by the copy button, and can be used to refer to an event type precisely when reporting an issue.
Login and account security
| Message code | Message template |
|---|---|
log_10001 | User {username} logged in |
log_err01_10001 | Unknown user login failed |
log_err02_10001 | User {username} login failed |
log_10069 | Social login success user |
log_10070 | Unlink social account for user {username} by admin |
log_10071 | Unlink social account for user {username} by self |
log_10003 | Verified user {username}'s new email |
log_10004 | Requested reset password email for user |
log_10005 | Changed password for user {username} (reset password email) |
log_10008 | Requested to change email |
log_10009 | Changed password |
log_10077 | Unlock user {username} by admin |
log_10078 | Reset mfa user {username} by admin |
log_10079 | Submit a request to delete my user account. |
log_10080 | Cancel my account deletion request |
User management
| Message code | Message template |
|---|---|
log_10016 | Created user |
log_10017 | Activated user |
log_10019 | Deleted user |
log_10010 | Changed user {username}'s email and company name |
log_10020 | Updated user {username}'s company name {old_company_name} to |
log_10021 | Updated user {username}'s password |
log_10015 | Updated user language from {old_lang} to |
log_10081 | Update map setting on user |
log_10084 | Create API key for user {username}, key |
log_10085 | Remove API key for user {username}, key |
Groups and permissions
| Message code | Message template |
|---|---|
log_10007 | Added users {usernames} to Group |
log_10072 | Updated permissions on group {group_name} for user |
log_10023 | Deleted user {username} on HMI Group |
log_10006 | Added users {usernames} to HMI |
log_10039 | Granted users {usernames} permissions to HMI |
log_10041 | Updated user {username}'s permission to HMI |
log_10042 | Deleted user {username}'s permission to HMI |
log_10018 | Added users {usernames} to folder |
log_10068 | Add permission for user {username} on folder |
Folders (Directory)
| Message code | Message template |
|---|---|
log_10013 | Created folder |
log_10011 | Renamed folder {old_folder_name} to |
log_10045 | Deleted folder |
log_10012 | Move resources to {parent_folder_name}, folders {resource_folder_names}, hmis |
HMI groups
| Message code | Message template |
|---|---|
log_10024 | Created HMI Group |
log_10025 | Renamed HMI Group {old_group_name} to |
log_10026 | Deleted HMI Group |
log_10014 | Added HMIs {hmis} to HMI Group |
log_10030 | Removed HMIs {hw_keys} from HMI Group |
HMI devices and Domain changes
| Message code | Message template |
|---|---|
log_10036 | Added HMI {hw_key} from this domain |
log_10035 | Removed HMI {hw_key} from this domain |
log_10051 | Added HMI {hw_key} with session ID/password |
log_10040 | Updated HMI {hw_key} information |
log_10098 | Update hmi {hw_key} location |
log_10082 | Add the HMI {hw_key} to favorites on the map |
log_10083 | Remove the HMI {hw_key} from favorites on the map |
log_10037 | Requested transferring HMI {hw_key} to domain |
log_10038 | Set HMI transfer to {status} on HMI {hw_key} from {source_domain_name} to |
log_10044 | Cancelled HMI transfer request for HMI |
EasyAccess 2.0
| Message code | Message template |
|---|---|
log_10046 | Started EasyAccess 2.0 trial for new HMI |
log_10049 | Started EasyAccess 2.0 trial for HMI |
log_10047 | Activated EasyAccess 2.0 for new HMI {hw_key} with card |
log_10050 | Activated EasyAccess 2.0 for HMI {hw_key} with card |
log_10048 | Deactivated EasyAccess 2.0 for HMI |
Dashboard and Dashboard subscriptions
| Message code | Message template |
|---|---|
log_10061 | Dashboard is activated for HMI |
log_10062 | Dashboard is activated for exists HMI |
log_10063 | Dashboard is trial for HMI |
log_10064 | Dashboard is trial for exists HMI |
log_10065 | HMI {hw_key} dashboard is deactivated |
log_10032 | Started Dashboard trial for new HMI |
log_10034 | Started Dashboard trial for HMI ({hw_key}) |
log_10043 | Changed Dashboard status HMI {hw_key} from {old_state} to |
log_10066 | HMI {hw_key} dashboard tag expansion card has been added |
log_10028 | Added Dashboard for HMI {hw_key} on exists dashboard subscription, name |
log_10029 | Activated Dashboard for new HMI {hw_key} on exists dashboard subscription, name |
log_10031 | Activated Dashboard for new HMI {hw_key} with card {activation_code} and dashboard subscription name |
log_10033 | Added a Dashboard subscription card {activation_code} to HMI {hw_key} and dashboard subscription name |
log_10056 | Create dashboard subscriptions the name is {dashboard_subscription_name} by card |
log_10057 | Add card to dashboard subscriptions the name is {dashboard_subscription_name} by card |
log_10058 | Update hmis on dashboard subscription the name is {dashboard_subscription_name} for new hmis |
log_10059 | Update dashboard subscription name {old_dashboard_subscription_name} to |
log_10060 | HMIs {hw_keys} dashboard subscription state change {old_state} to |
log_10055 | Delete dashboard subscriptions the name is |
log_10090 | Create dashboard |
log_10091 | Publish dashboard |
log_10092 | Update dashboard {name} info |
log_10094 | Update dashboard {name} permission |
log_10095 | Remove dashboard {name} publish mode |
log_10093 | Delete dashboard |
Alarms
| Message code | Message template |
|---|---|
log_10105 | Create alarm rule |
log_10107 | Update alarm rule |
log_10106 | Delete alarm rule |
log_10108 | Create alarm categories |
log_10109 | Update alarm categories |
log_10110 | Delete alarm categories |
log_10096 | Ack alarm {alarm_name} on dashboard |
log_10097 | Ack alarm {alarm_name} on management |
log_10067 | HMI {hw_key} alarm histories have been deleted |
Data sources and backups
| Message code | Message template |
|---|---|
log_10100 | Update or create datasource |
log_10101 | Update datasource meta |
log_10099 | Backup datasource |
log_10102 | Backup trend data |
log_10103 | Backup history table |
log_10104 | Check dashboard project datasource |
Gallery
| Message code | Message template |
|---|---|
log_10086 | Upload new file on gallery |
log_10088 | Update file on gallery |
log_10089 | Duplicate a file from the gallery |
log_10087 | Delete file on gallery |
Domain and system settings
| Message code | Message template |
|---|---|
log_10002 | Created Domain |
log_10111 | Update domain name |
log_10073 | Updated domain security setting |
log_10074 | Updated custom domain setting |
log_10075 | Updated user security setting |
log_10076 | Updated mfa setting |
log_10052 | Updated activity report setting |
log_10053 | Updated multi-user connections setting |
log_10054 | Updated project name update setting |
Limitations and Notes
- The queryable data goes back at most 180 days: The system provides activity logs from the most recent 180 days only; records older than 180 days cannot be queried.
- A single query covers at most 3 days: If the specified interval exceeds 3 days, the system automatically adjusts the start time to 3 days before the end time and displays a [Time range restriction] notice. To review a longer period, query and export it in segments.
- [Last 7 Days] and [Last 30 Days] are subject to the same 3-day limit: Selecting either quick range still returns only the records within 3 days before the end time.
- The start time must be earlier than the end time: Otherwise the query is not submitted and a notice is displayed.
- Accessible to Domain superusers only: The Domain Superuser permission is required; accounts with other permissions do not see [Audit] in the menu.
- Logs are read-only: No entry can be created, modified, or deleted.
- Results are not refreshed automatically: Use the refresh button or re-apply the time range.
- Login-related events may show
anonymous: Login events are generated before authentication completes, so the [User] column may showanonymous; the account name and browser information are recorded in the [Message] column. - The export covers the entire query result: It is not affected by the current page or page size.
FAQ
Q: Why does selecting [Last 7 Days] return only the last 3 days of records? A: A single query covers at most 3 days. When a longer range is selected, the system adjusts the start time to 3 days before the end time and displays a [Time range restriction] notice. Query longer periods in segments.
Q: What does 200 in the [Result] column mean? A: The column shows the HTTP status code of the operation. Codes beginning with 2 (such as 200) appear as a green badge and indicate success; all other codes appear as a red badge and indicate failure.
Q: Does the exported CSV contain only the current page? A: No. The export contains all records returned by the current query, regardless of the current page and page size.
Q: Why do some entries show anonymous in the [User] column? A: Login-related events are generated before authentication completes, when no account is yet associated with the request, so the column shows anonymous. The account name used in the login attempt and the browser information are recorded in the [Message] column.
Q: What does the copy button copy? A: The message code of that entry (for example, log_10001), which can be used to refer to the event type precisely when reporting an issue.
Q: Are failed logins and unauthorized operations recorded? A: Yes. Failed operations are recorded as well, with the corresponding HTTP status code shown as a red badge in the [Result] column.