Analyze Data
Overview
Analyze Data is an in-depth analysis tool under the Data Source page that lets users view changes in tag values as trend charts or historical data tables, and use aggregate settings to consolidate data over a large time range, making it easy to quickly identify value trends and anomalies.
Use Cases and Access
Suited for users who need to track changes in tag values, compare trends across multiple tags, or export historical data for offline analysis.
- Click [Data Source] in the left menu.
- Select the HMI you want to view.
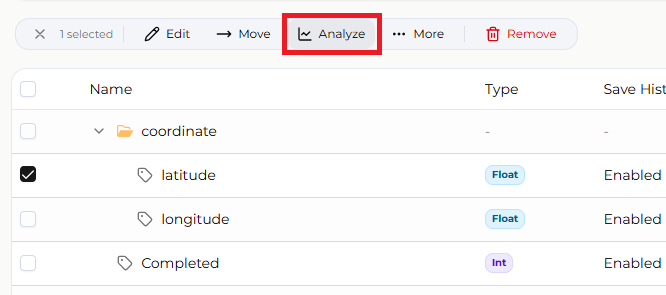
- In the tag list, select the tags you want to analyze (up to 5 at a time; multiple selections can be compared together).
- Click the [Analyze Data] icon at the top.
Feature Details
Trend Chart
The trend chart presents changes in a tag's value over time graphically. You can switch between real-time mode and historical mode to view data across different time ranges.
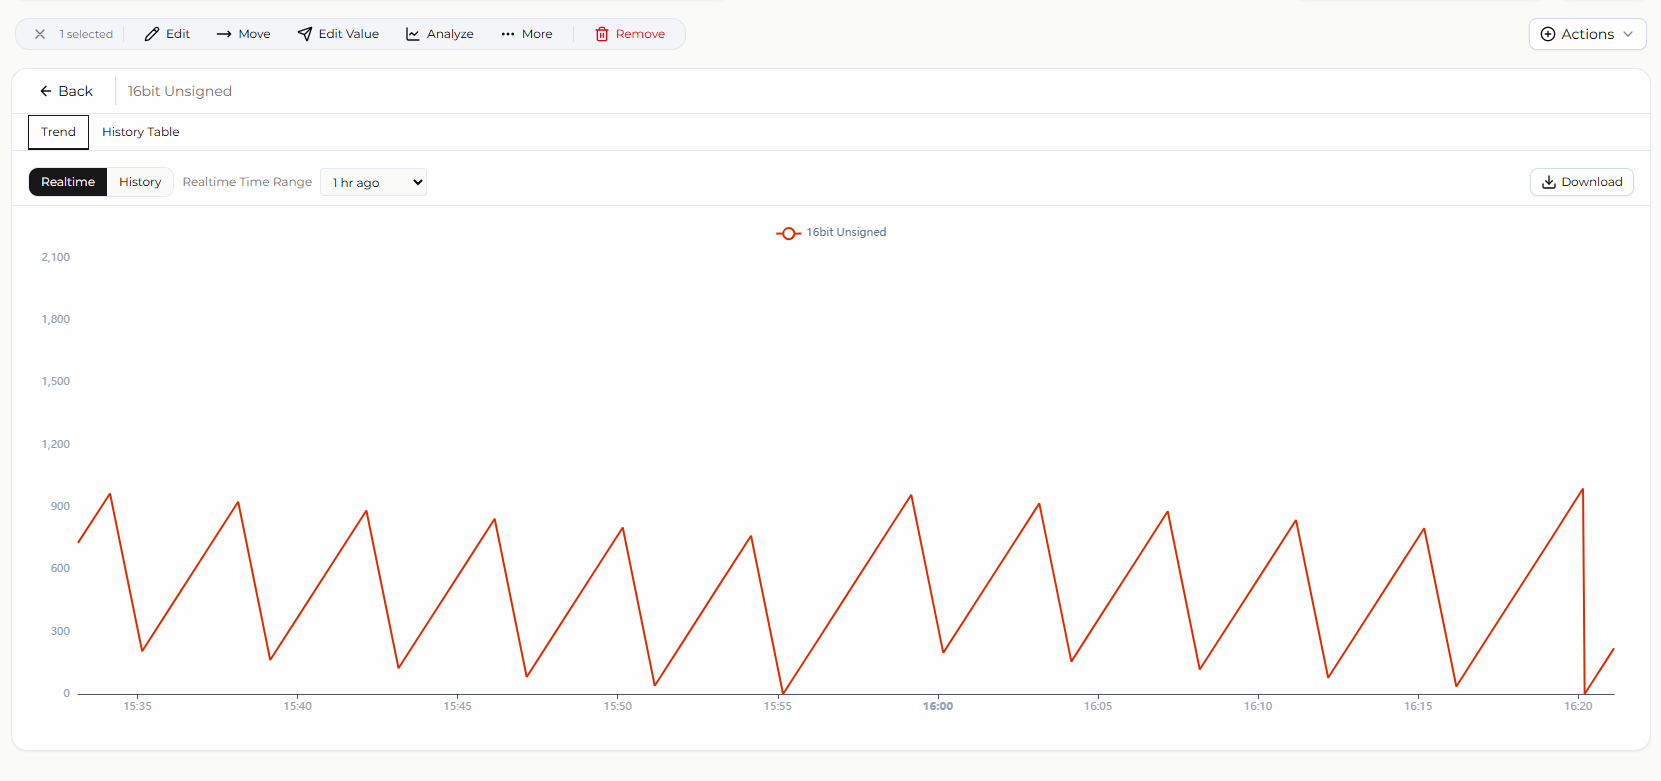
Real-time Mode
Real-time mode continuously displays the tag's latest value changes; the update frequency depends on the tag's [Interval] setting.
- The time range can be set up to 6 hours.
- You can use the mouse wheel to zoom the chart, but doing so switches to [Historical Mode].
- You can drag the chart left or right with the mouse to view data at different points in time, but doing so switches to [Historical Mode].
- Raw data can be downloaded from the top right; the number of records downloaded cannot exceed the Data Limit.
Historical Mode
Historical mode displays the tag's historical data within a specified time range.
- The time range can be set up to 1 year.
- You can use the mouse wheel to zoom the chart.
- You can drag the chart left or right with the mouse to view data at different points in time.
- Raw data can be downloaded from the top right; the number of records downloaded cannot exceed the Data Limit.
- You can enable Aggregate Mode to reduce the data volume, and select a different [Window Size] to view value trends.
- If the time range, window size, or other settings exceed the Data Limit, the system automatically splits the query into multiple segments and reads them sequentially, which slows down chart rendering; it is recommended to adjust the [Time Range] or [Window Size] to reduce the amount of data retrieved per request.
Tag History
Tag History presents the tag's historical data within a specified time range in table format.
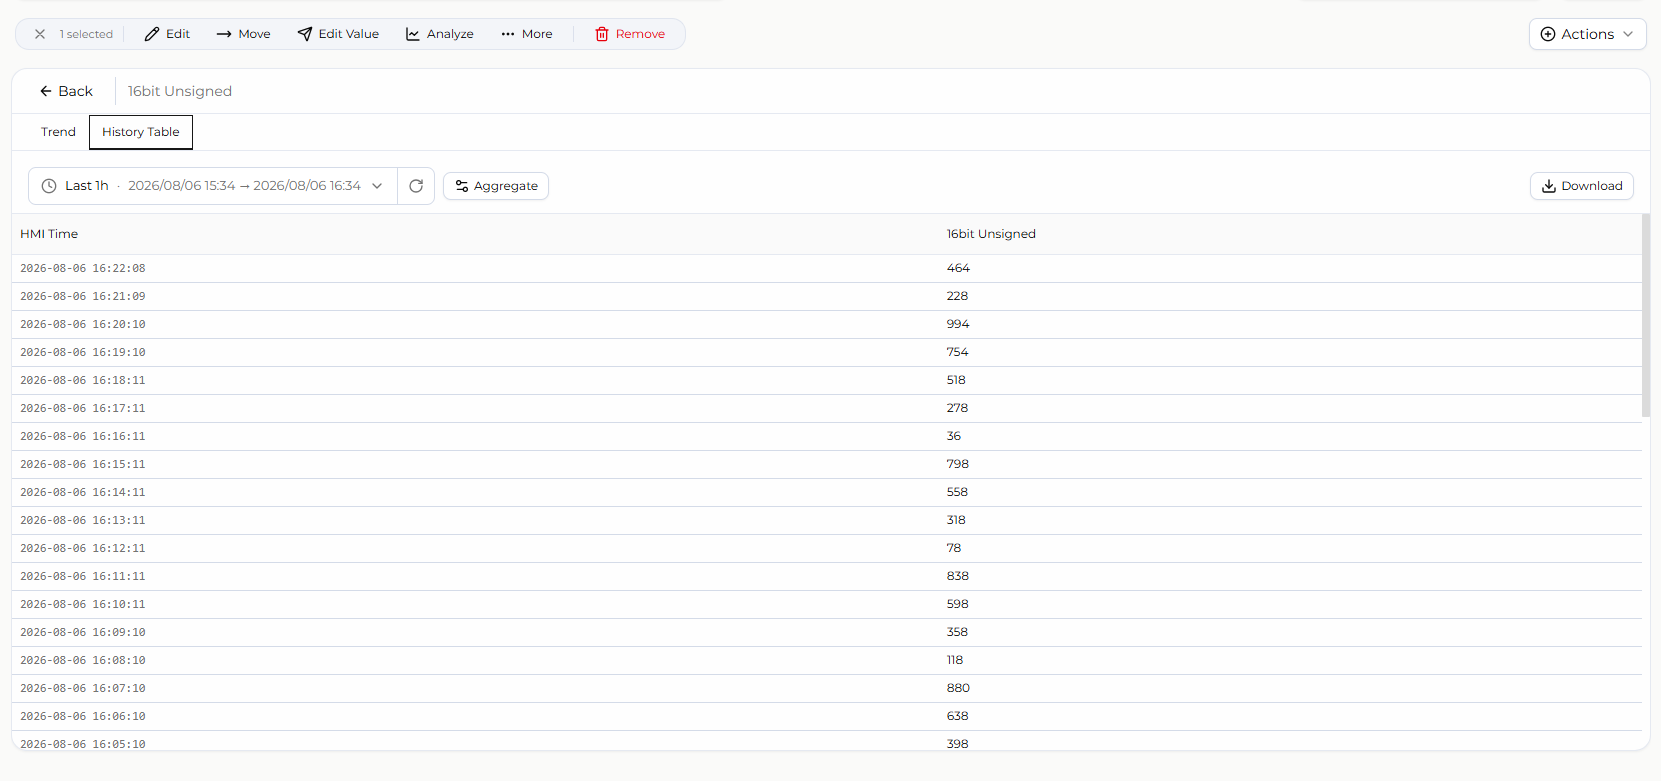
- The time range can be set up to 1 year.
- Raw data can be downloaded from the top right; the number of records downloaded cannot exceed the Data Limit.
- You can enable Aggregate Mode to reduce the data volume, and select a different [Window Size] to view value trends.
- If the time range, window size, or other settings exceed the Data Limit, the system automatically splits the query into multiple segments and reads them sequentially; you will need to adjust the [Time Range] or [Window Size] to reduce the data volume.
Aggregate Mode
Aggregate Mode consolidates raw data from different points in time into fixed intervals before plotting it, allowing multiple tags to be compared on the same time scale; the resulting values are statistical results and may differ slightly from the raw values.
Window Size
Sets how often data is merged into a single point:
5 seconds
10 seconds
15 seconds
30 seconds
1 minute
5 minutes
10 minutes
15 minutes
30 minutes
1 hour
2 hours
4 hours
6 hours
12 hours
1 day
The available window sizes are automatically adjusted based on the current time range; options that do not apply are shown in gray with a warning prompt.
Calculation Mode
Sets how data within each interval is aggregated:
- Average: Calculates the average value within the interval.
- Sum: Calculates the sum within the interval.
- Maximum: Takes the maximum value within the interval.
- Minimum: Takes the minimum value within the interval.
- Median: Takes the median value within the interval.
- Percentile: Takes the value at a specified percentile; requires configuring the Percentile field.
- Count: Counts the number of data points within the interval.
- Mode: Takes the most frequently occurring value within the interval.
Fill
Sets how to handle intervals that contain no data after merging:
- None: Does not fill a value.
- Linear: Fills with a value derived from linear regression.
- Null: Fills with null.
- Previous: Fills using the value from the previous interval as a reference.
Derivative
When enabled, additionally calculates the rate of change of the data.
- This option is disabled when the calculation mode is set to [Mode].
Percentile
Sets the percentile value to retrieve, in the range 0–100, supporting up to two decimal places.
- Editable only when the calculation mode is set to [Percentile]; this field is disabled for all other modes.
Limitations and Notes
To ensure system stability, data retrieval is currently subject to the following limits:
Maximum of 4,320 Records per Retrieval
- The trend chart's real-time mode retrieves data at 5-second intervals, which works out to a maximum of 6 hours of data: 60 seconds × 60 minutes × 6 hours ÷ 5 seconds = 4,320 records.
- If Aggregate Mode is enabled, the system instead retrieves data using the [Window Size] as the unit; for example, if the window size is set to 1 minute, a maximum of 3 days of data can be retrieved: 60 seconds × 60 minutes × 24 hours × 3 days ÷ 60 seconds = 4,320 records.
Per-HMI Traffic Limit
A single HMI can retrieve approximately 100 MB of data within 15 minutes at most; exceeding this limit will cause retrieval to fail.
FAQ
Q: What happens to the chart when a query exceeds the single-retrieval limit? How can this be addressed? A: The system automatically splits the time range into multiple segments and reads them sequentially, which slows down chart rendering. You can address this with any of the following:
- Adjust the time range to within the limit.
- Enable Aggregate Mode and increase the [Window Size] to reduce the amount of data retrieved each time.
- Manually split the time range into multiple segments, query them in batches, and merge the results yourself.